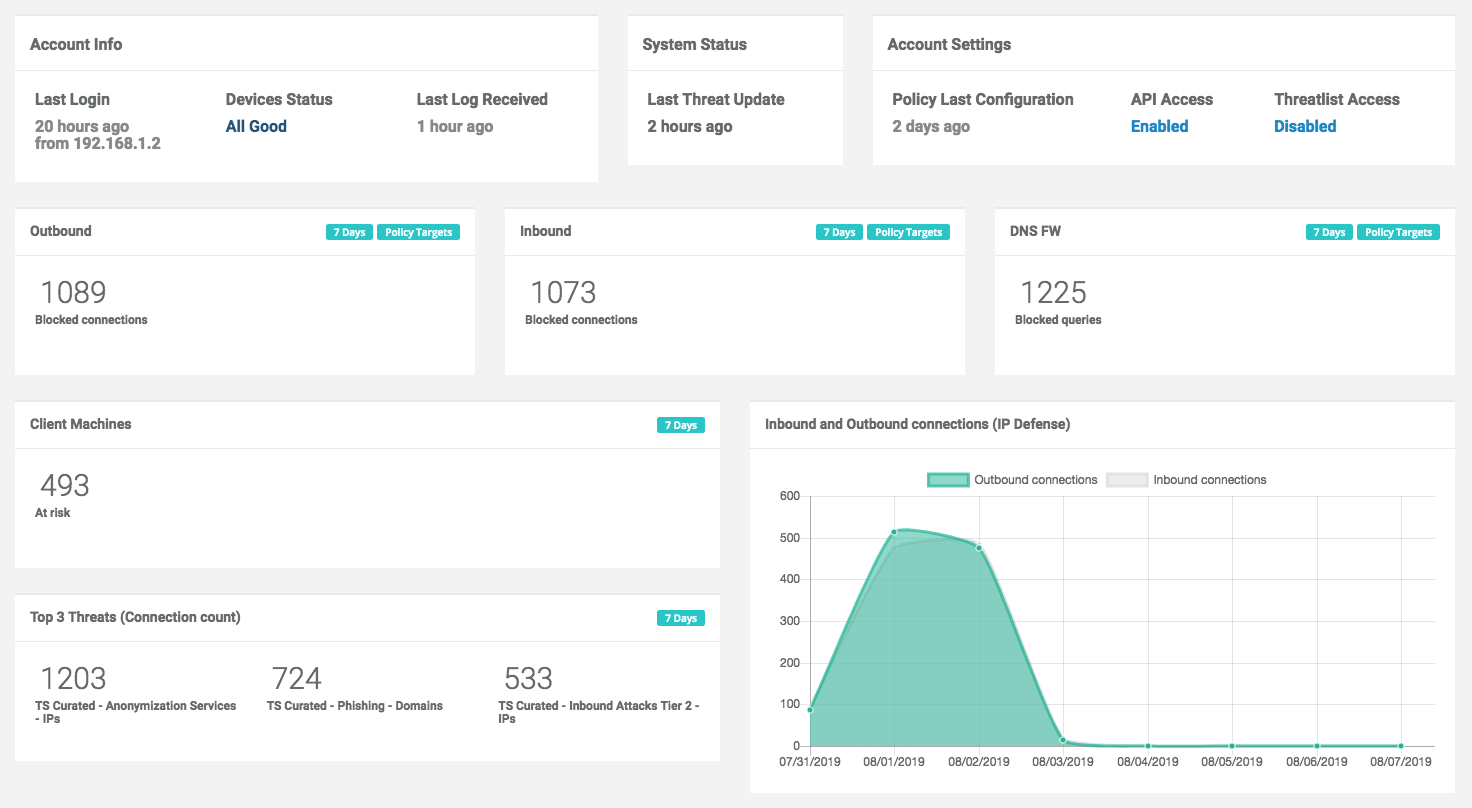
After logging in, the Admin Portal will display a dashboard with the following sections:
Account Info
- Last Login: the IP address and date of the last time the user logged into the current organization.
- Device Status: links to devices that have not retrieved a policy or uploaded logs in the last three days, if any.
- Last Log received: the last time any devices associated with the account uploaded log data.
System Status
- Threat Update: the last time targets were updated in the ThreatSTOP database.
Account settings
- Policy last configuration: the last time a policy configuration change was made in this account.
- API Access: indicates if this account has API access.
- ThreatList Access: indicates if SIEM integration features are enabled on this account.
Report highlights
- Outbound: number of outbound connections blocked in the last 7 days accross all IP devices.
- Outbound: number of inbound connections blocked in the last 7 days accross all IP devices.
- DNS FW: number of DNS queries blocked in the last 7 days accross all DNS devices.
- Client machines: number of internal machines that originated a blocked connection or blocked DNS query (last 7 days).
- Top 3 Threats: Targets most frequently associated with blocked connections (last 7 days).
- The graphs show the number of blocked connections (inbound/outbound) and blocked DNS queries for each of the last 7 days.
Note: these reports only include hits against targets in the policies that are active on your ThreatSTOP devices; they don’t include matches against threats in the ThreatSTOP database that are not present in your policies. Only the blocks from logs that have been uploaded and processed by ThreatSTOP are included. They also only include blockers connections/queries, not allowed or pass-thru.