Overview
The DNS Defense Reports provide a comprehensive view of the DNS Lookups that were blocked by your DNS server because the requested record (query or results) is an IOC present in the ThreatSTOP policy loaded on your server.
Reports are provided as roll-up summaries for a quick overview, and provide the ability to drill down into the details of the DNS Lookups.
The ThreatSTOP system retains log data for 35 days after the time of the log event.
The DNS filtering feature (RPZ) used by most DNS servers implementing a ThreatSTOP policy is can block DNS lookups based on:
- The requested record itself.
- DNS records in the DNS resolution chain (e.g. a CNAME record).
- The record(s) that the query resolved to (e.g. an IP address in an A record).
- The name or IP address of DNS servers in the resolution chain.
The reports will show the queried name but also the RPZ record that caused the query to be blocked. The RPZ record is the IOC in ThreatSTOP’s Threat Intelligence Database.
Filtering
Filters
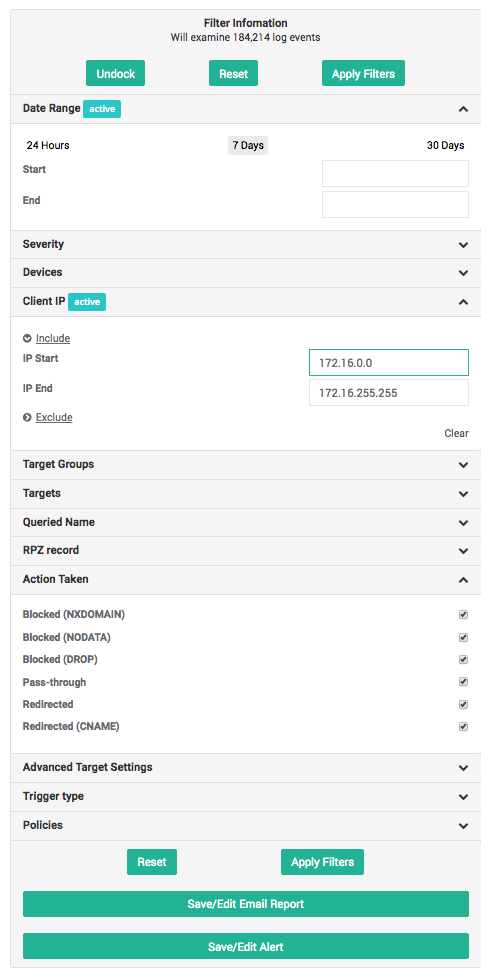
Filters provide a mechanism to restrict the scope of the reports, based on the attributes of the log events. The following filters are available:
- Date Range: This is the time period that the report covers (event date). You can select specific dates and times (format: MM/DD/YY HH:MM:SS), or pick one of the available presets
- Last 24 Hours.
- Last 7 Days.
- Last 30 Days.
- Severity: The severity level of the target(s) associated with the IOC (described here).
- Devices: The list of DNS firewalls currently configured in your account, i.e. the device implementing your ThreatSTOP policy. This filter restricts reports to the DNS lookups blocked by a specific DNS server, if you have more than one.
- Client IP: Restricts the reports to the DNS lookups made by DNS clients in the selected IP address range.
- Target Types: Limits the results to the DNS lookups that match the selected target type.
- Target Bundles: Limits the results to the DNS lookups matching the targets present in the selected target bundles. This is useful to show what is blocked by a having the selected bundles in your policy.
- Targets: Limits the results to the DNS lookups matching the selected individual targets.
- Queried Name: Text search for a domain name queried in the DNS lookups.
- RPZ Record: Text search for the DNS record that caused the query to be blocked.
- Action Taken: Limits results based on what actions were taken for the DNS lookups:
- Blocked (NXDOMAIN): Network traffic is blocked with the NXDOMAIN error (no records for the requested domain name)
- Blocked (NODATA): Network traffic is blocked with the NODATA error (no records of the requested type for the the requested domain name)
- Blocked (DROP): Network traffic is dropped, with no information provided to the requesting service. The client retried the request with its next configured DNS server, if any.
- Pass-Through: Network traffic may access the requested system.
- Redirected: Network traffic is that have been pointed to a different location such as a Walled Garden.
- Only targets present in policy: This filter will limit the results to the targets included in the policy attached to the device. If unchecked, the reports will also show targets associated with the IP address that are not currently blocked by your policy. For example: a lookup may have been blocked by your device because your policy includes a malware target that contains the requested DNS record, but that DNS record is also associated with a cryptomining target. Showing all targets will also show the cryptomining target, although it is not in your policy.
- Trigger type: Includes targets based on the action that triggered the firewall to take an action.
- QNAME: the requested domain name (QNAME) matches a DNS name in the policy.
- RPZ-IP: an IP address in the response (e.g. A record) matched an IP address in the policy.
- NSDNAME: the Name Server Domain Name (NSDNAME) matches a DNS server name in the policy.
- NSIP: the Name Server IP address (NSIP) matches a DNS server IP address in the policy.
- Policies: Limits the reports to the policy (or policies) selected.
Tips
- You can open or close the filter widget by clicking on the chevrons (). Once open, you can also choose to keep it docked so it will remain displayed as you browse through the reports.
- The number of active filters is displayed at the top of the reports page.
- The Filter widget shows which filters are set with an Active label.
- Clear each filter individually (Clear label) or remove all filters at once by clicking on the Reset button.
- You can autocomplete subnets in the IP address filters by typing a subnet size (/nn) at the end of the start IP address.
- As you change settings, the widget will display the number of log events that the filter currently matches.
- When a target is part of a bundle and the bundle is in your policy (or policies), the reports will show the name of the bundle(s) next to the target. This can be used to identify which bundle in your policy caused the DNS lookup to be blocked or logged.
Filters and drill down
Report Types
Overview
The DNS Overview provides a high level summary of the severity of the blocked DNS lookups, the number of internal devices involved, and the type of Targets that the blocked lookups are associated with.
- Number of requests for each Severity: number of blocked DNS lookups broken down by severity levels. Drill down: Threat Summary for the selected severity.
- Number of machines for each Severity: number of devices that have attempted a DNS lookup blocked by your policy. Drill down: Traffic summary for the selected severity.
- Number of requests for each Threat Group: number of blocked DNS lookups broken down by Threat Types (top 7 by volume). Drill down: Threat Summary for the selected Threat Type.
DNS Threat Summary
| Purpose | Identify the severity and type of threats found in the logs. |
| Data | This report breaks down the total number of logged DNS lookups by severity level (Target severity score or User-Defined List) and by target. |
| Graph | The bar graph shows the number of DNS lookups for each severity level. |
| Settings | N/A |
| Drill down | You can drill down to the detailed log entries by clicking on the severity levels or target name. |
Top 20 IOCs
| Purpose | Identify the IOCs found most often in DNS lookups. |
| Data | The Top 20 IOC report shows the IOCs most often found in DNS requests and responses, along with the targets that contains them. |
| Graph | The bar graph shows the IOCS and count of blocked DNS queries. |
| Settings | N/A. |
| Drill down | Clicking on an entry will show the client IP address summary for the selected lookups (the list of IP addresses that originated them). |
DNS Client Summary
| Purpose | Identify which client IP addresses are involved in high severity events. |
| Data | The Client Summary report shows the number of blocked DNS lookups broken down by client IP address first, severity level second, and target name third. |
| Graph | The bar graph shows the number of DNS lookups by IP address and severity level. |
| Settings | The data can be sorted by IP address or by number of DNS lookups. |
| Note | The report supports a break down by IP address up to a class C subnet (/24, or 256 addresses). |
| Drill down | Clicking on the bar graph will drill down into the DNS lookups details filtered for the client IP address and severity score. Clicking on an IP address will drill down into the DNS Lookup details, filtered for the address. Clicking on the severity score will add a filter for the severity and clicking on the target name will add a filter for that target. |
DNS Combined Summary
| Purpose | Identify which internal IP addresses are involved in high severity events. |
| Data | The Combined Summary report shows all logged DNS lookups broken down by severity and target first and by internal IP address second. |
| Graph | The bar graph shows the number of DNS lookups by IP address and severity level. |
| Settings | N/A. |
| Drill down | Clicking on the bar graph will drill down into the DNS lookups details filtered for the selected client IP address and severity score. Clicking on a severity level will drill down into the DNS lookups details for that severity. Clicking on the target name will add a filter for the selected target and clicking on an IP address will filter the DNS lookup logs for that address. |
DNS Date Summary
| Purpose | Identify the volume and severity of events over time. |
| Data | This report breaks down the total number of logged DNS lookups by severity level for each slice of the selected time duration. |
| Graph | The bar graph shows the number of DNS lookups for each time period and each severity level. |
| Settings | You can select the time period used for aggregating the log entries. The available selections are hourly, daily, weekly and monthly. |
| Note | Ensure that the date range selected in the filters is compatible with the time period setting. |
| Drill down | You can click on the time slice to drill down to the detailed log entries for that time. Clicking on the severity level in either the bar graph or the table data will add a filter for the selected severity. |
Detailed Reports
| Purpose | Show the details of the logged DNS lookups. |
| Data | Data is broken up into columns and displayed in a tabular format, columns displayed can be controlled using the Columns button. Additionally the data can be sorted by clicking the column header. |
| Settings | Fields are configurable and listed below. The list of selected columns is retained across browser sessions. |
| Note | The details report will return up to, 5,000 records displayed for a given filter set. If you need to see additional entries, please refine the filter configuration. |
| Drill down | You can click on the IOC (the external IP address) and RPZ records to access their Check IOC page. Right-clicking them will display a menu to quickly add them to any of your user-defined lists, for example to whitelist them. |
The following settings are available:
- Time: Date and time a connection attempt to the requested FQDN was made. This is displayed in the following format:
YYYY-MM-DD HH:MM:SS - Device: Nickname of the device that processed the request.
- Client IP: IP Address of the device that issued the DNS request.
- FQDN Requested: The URI for the FQDN the system was attempting to contact.
- Action: Action taken by the DNS server. These can be one of two actions:
- NXDOMAIN: Reply to the query indicated that the domain does not exist.
- NODATA: Reply to the query indicated the record does not existing.
- PASSTHRU: Request was whitelisted and allowed to be made, bypassing any other matching filtering rule.
- DROP: No reply was made to the query.
- local-data: The DNS request was redirected (e.g. to a walled garden).
- Cause: The reason the action was taken. It can be one of the following:
- QNAME: the Qualified Name (QNAME) matches an entry in the RPZ.
- RPZ-IP: the Response Policy Zone (RPZ) requested matches an entry in the RPZ.
- NSDNAME: the Name Server Domain Name (NSDNAME) matches an entry in the RPZ.
- NSIP: Name Server IP address (NSIP) matches and entry in the RPZ.
- Record: Contains the DNS name or IP address that caused the DNS query to be filtered.
- Targets: Details which targets the record is listed in.
- ID: This is a unique ID for the log line in the report. This is used for diagnostic purposes, and may occasionally be requested by ThreatSTOP Support.
The returned results can be exported in a CSV file by clicking on the Export to CSV button. The columns in the CSV file will match the columns currently selected.
The name of the FQDN and RPZ records may be truncated if they are very long. A tooltip will show the full version, and the CSV export will contain the complete names as well.
Email Reports
- Email reporting for IP firewalls is covered in our Email Reports article.
- Email alerts are covered in our Email Alerts article.