Overview
The IP Defense Reports provide a comprehensive view of the network connections that were blocked by your Firewall - typically because the external IP address in the connection is an IOC present in the ThreatSTOP policy loaded on your firewall.
Reports are provided as roll-up summaries for a quick overview, and provide the ability to drill down into the details of the TCP/IP connections.
The ThreatSTOP system retains log data for 35 days after the time of the log event.
Filtering
Filters
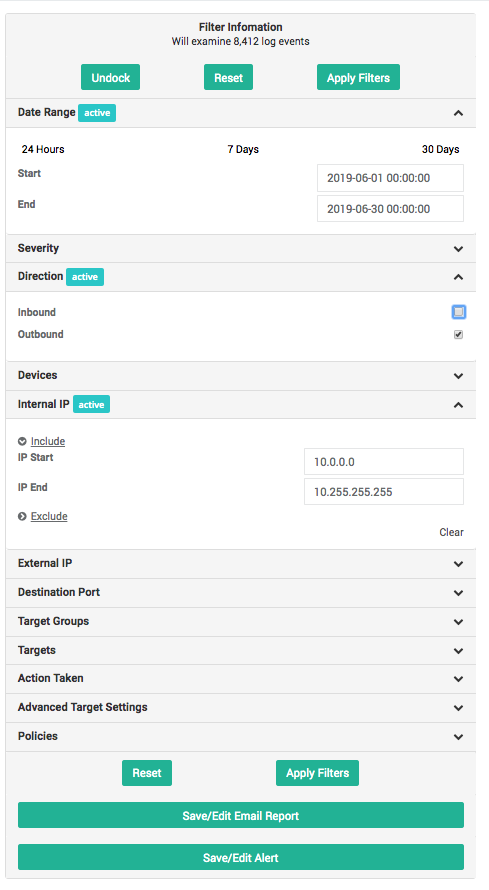
Filters provide a mechanism to restrict the scope of the reports, based on the attributes of the log events. The following filters are available:
- Date Range: This is the time period that the report covers (event date). You can select specific dates and times (format: MM/DD/YY HH:MM:SS), or pick one of the available presets
- Last 24 Hours.
- Last 7 Days.
- Last 30 Days.
- Severity: The severity level of the target(s) associated with the IOC (described here).
- Direction: Restricts results to inbound traffic (connections from the IOC to your network), or outbound traffic (connections initiated from your network to the IOC), or both.
- Devices: Contains the list of IP devices currently configured in your account, i.e. the device implementing your ThreatSTOP policy. This filter restricts reports to the connections blocked by a specific device, if you have more than one.
- Internal IP: Restricts the reports to the connections where the internal IP address is within the specified range. This is the IP address of your internal devices.
- External IP: Restricts the reports to the connections where the external IP address is within the specified range. This is the IP address of the IOC.
- Destination port: Restricts the reports to the connections that match the specified destination UDP/TCP port(s). The filter can have a list of ports to include and a list of ports to exclude. Both entries can be written as:
- a single port (between 1 and 65535).
- a comma separated list of ports (port1,port2).
- a range (port1-port2).
- Target Types: Limits the results to the connections that match the selected target type.
- Target Bundles: Limits the results to the connections matching the targets present in the selected target bundles. This is useful to show what is blocked by a having the selected bundles in your policy.
- Targets: Limits the results to the connections matching the selected invididual targets.
- Action Taken: Limits the results based on what actions were taken for the connections.
- Block: Network traffic that has been blocked by the policy.
- Allow: Network traffic that has been allowed to pass through to the network (e.g. whitelisted addresses).
- Only targets present in policy: This filter will limit the results to the targets included in the policy attached to the device. If unchecked, the reports will also show targets associated with the IP address that are not currently blocked by your policy. For example, a connection may have been blocked by your device because your policy includes a malware target that contains the IP address, but that address is also associated with a cryptomining target.
- Policies: Limits the reports to the policy (or policies) selected.
Tips
- You can open or close the filter widget by clicking on the chevrons (). Once open, you can also choose to keep it docked so it will remain displayed as you browse through the reports.
- The number of active filters is displayed at the top of the reports page.
- The Filter widget shows which filters are set with an Active label.
- Clear each filter individually (Clear label) or remove all filters at once by clicking on the Reset button.
- You can autocomplete subnets in the IP address filters by typing a subnet size (/nn) at the end of the start IP address.
- As you change settings, the widget will display the number of log events that the filter currently matches.
- When a target is part of a bundle and the bundle is in your policy (or policies), the reports will show the name of the bundle(s) next to the target. This can be used to identify which bundle in your policy caused the connection to be blocked or logged.
Filters and drill down
Report Types
Overview
The IP Overview provides a high level summary of the severity of the blocked connections, the number of internal devices involved, and the type of Targets they are associated with.
Connections are reported based on their direction - Inbound and Outbound.
- Number of Blocked Connections for each Severity: number of blocked connections broken down by severity levels. Drill down: Threat Summary for the selected severity.
- Number of Clients for each Severity: number of devices that have attempted a connection blocked by your policy. Drill down: Traffic summary for the selected severity.
- Number of Blocked Connections for each Threat Group: number of blocked connection broken down by Threat Types (top 7 by volume). Drill down: Threat Summary for the selected Threat Type.
IP Threat Summary
| Purpose | Identify the severity and type of threats found in the logs. |
| Data | This report breaks down the total number of logged connections by severity level (Target severity score or User-Defined List) and by target. |
| Graph | The bar graph shows the number of connections for both traffic directions and for each severity level. |
| Settings | Inbound and Outbound connections are shown separately. The graph and tables are shown according to the direction filter. |
| Drill down | You can drill down to the detailed log entries by clicking on the severity levels or target name. |
IP Combined Summary
| Purpose | Identify which internal IP addresses are involved in high severity events. |
| Data | The Combined Summary report shows all logged connections broken down by target first and by internal IP address second. |
| Graph | The bar graph shows the number of connections for both traffic directions and for each severity level. |
| Settings | Inbound and Outbound connections are shown separately. The graph and tables are shown according to the setting of the direction filter. |
| Drill down | Clicking on the bar graph will drill down into the connection details filtered for the selected severity score. Clicking on a target will drill down into the connection details, filtered for the target. Clicking on an IP address will drill down into the connection details, filtered for the target and internal IP address. |
IP Date Summary
| Purpose | Identify the volume and severity of events over time. |
| Data | This report breaks down the total number of logged connections by severity level for each slice of the selected time duration. |
| Graph | The bar graph shows the number of connections for each time period and each severity level. |
| Settings | You can select the time period used for aggregating the log entries. The available selections are hourly, daily, weekly and monthly. The report also splits the data between inbound and outbound connections. |
| Note | Ensure that the date range selected in the filters is compatible with the time period setting. |
| Drill down | You can click on the time slice to drill down to the detailed log entries for that time. Clicking on the severity level in either the bar graph or the table data will add a filter for the selected severity. |
Traffic Summary
| Purpose | Identify the volume and severity of events by IP address. |
| Data | This report breaks down the total number of logged connections by severity level for each IP address - internal or external. |
| Graph | The bar graph shows the number of connections for each time period and each severity level. |
| Settings | The report can focus on both internal and external IP addresses (see table below). The data can be sorted by IP address or by volume of connections. |
| Note | The report supports a break down by IP address up to a class C subnet (/24, or 256 addresses). |
| Drill down | You can click on the IP address to drill down to the detailed log entries for address. Clicking on the severity level (graph or table) will set an additional filter for that level. Clicking on a target will show the detailed log entries for the IP address and selected target. |
Internal IPs, External IPs, and the Direction Filter
The following chart shows how to interpret the direction of traffic (inbound or outbound) in relation to the location (internal or external) of the IP address shown in the reports.
| Location Direction |
Internal IP addresses | External IP addresses |
| Inbound | Shows the addresses of devices inside your network that the external addresses are trying to connect to. | Shows the addresses of devices outside of your network trying to connect to your internal devices. |
| Outbound | Shows the addresses inside your network that are trying to connect to. | Shows the addresses outside your network that your devices are trying to connect to. |
| Inbound and Outbound | Shows the devices inside your network that are making a connection, or the target of a connection. | Shows the external IP addresses that your devices are making a connection to, or receiving a connection attempt from. |
Detailed Reports
| Purpose | Show the details of the logged connections (blocked or allowed). |
| Data | Data is broken up into columns and displayed in a tabular format, columns displayed can be controlled using the Columns button. Additionally the data can be sorted by clicking the column header. |
| Settings | Fields are configurable and listed below. The list of selected columns is retained across browser sessions. |
| Note | The details report will return up to, 5,000 records displayed for a given filter set. If you need to see additional entries, please refine the filter configuration. |
| Drill down | You can click on the IOC (the external IP address) to access its Check IOC page. Right-clicking the IOC will display a menu to quickly add it to any of your user-defined lists, for example to whitelist it. |
The following settings are available:
- Time: Date and time a connection attempt to the requested FQDN was made. This is displayed in the following format:
YYYY-MM-DD HH:MM:SS - Device: Nickname of the device that processed the request.
- Source IP: IP Address of the device making the connection attempt. This can be an internal or external IP address.
- Source Port: TCP or UDP port from which data was being sent.
- Destination IP: IP Address of the device for which the connection was intended. This can be an internal or external IP address.
- Destination Port: TCP or UDP port to which data was being sent. This can help to identify the type of communication being attempted.
- Action: Action taken by the firewall. These can be one of two actions:
- Block: Communications between the Source and Destination IP was not allowed.
- Allow: Communications between the Source and Destination IP was allowed.
- Direction: The direction the traffic was flowing at the time of the log entry two directions are possible:
- Out: Device inside your network attempting to connect to an IP address outside.
- In: Device outside your network attempting to connect to an IP address inside.
- Targets: Details which target(s) contain the IP address.
- ID: This is a unique ID for the log line. This is used for diagnostic purposes, and may on occasion be requested by ThreatSTOP Support.
The returned results can be exported in a CSV file by clicking on the Export to CSV button. The columns in the CSV file will match the columns currently selected.
Email Reports
- Email reporting for IP firewalls is covered in our Email Reports article.
- Email alerts are covered in our Email Alerts article.